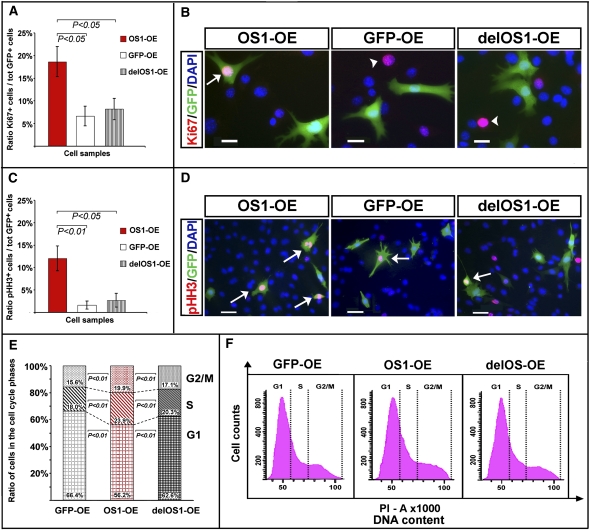
FIGURE 2.
Vax2os1 overexpression impairs the cell cycle of 661W cells. Characterization of the 661W cells undergoing a differentiation protocol for 48 h (see text for details). (A,B) Ki67 fluorescence immunostaining. (C,D) Phospho-histone-H3, pHH3, fluorescence immunostaining. In A and C, the histograms show that the Vax2os1-transfected cells (OS1-OE) are characterized by an increase in the number of cells positive to Ki67 (A) or pHH3 (C) compared with the pool of control transfected cells (GFP-OE and delOS1-OE; see text for details). In B, the arrow indicates one Vax2os1-transfected cell expressing Ki67; arrowheads indicate cells expressing only Ki67 in control experiments. In D, arrows indicate cells expressing both pHH3 and GFP in either the OS1-OE or the GFP-OE and delOS1-OE cells. (E,F) Cell cycle analysis with propidium iodide (PI). (E) Histograms show the distribution (in percentage) of the single cycle phases for the OS1-OE cells (middle bar) in comparison with the GFP-OE (left bar) and delOS1-OE control (right bar) cell pools. Differences between the GFP-OE and delOS1-OE were not significant. (F) Flow cytometric DNA content analysis of the OS1-OE cells and GFP-OE and delOS1-OE control cells stained with PI. (A,C) Statistical P-values from likelihood ratio test for the negative binomial; (E) statistical P-value from χ2 test. Magnifying bars, 20 μm (B); 40 μm (D). (A,C) Data are represented as means ± SEM, n = 4.

