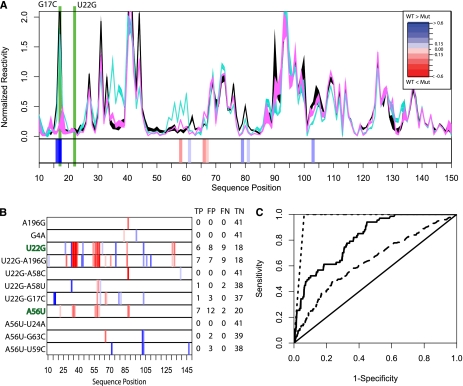
FIGURE 3.
(A) SHAPE chemical mapping data scaled and averaged over six repeats for the WT (black), U22G (cyan), and U22G-G17C (magenta) FTL 5′ UTRs. The heatmap below the data shows that the U22G-G17C haplotype restores base-pair probability to near WT conformation, as predicted by SNPfold. (B) SHAPE data heatmaps indicating experimentally determined SNP-induced changes in probability of a base being paired for hyperferritinemia (U22G and A56U) and nondiseased genotypes. We made orthologous predictions using SNPfold and report the True Positive, False Positive, and True Negative, and False Negative (TP, FP, TN, and FN, respectively) rates when comparing SNPfold predictions to SHAPE chemical data. (C) ROC analysis of the SNPfold algorithm for predicting changes in IRE base-pairing probability (solid line, AUC = 0.86) and identifying RiboSNitches (dashed line, AUC = 0.97), and using traditional minimum free energy (e.g., mFold) calculations (long dashes, AUC = 0.62). ROC analysis includes SHAPE data collected on the additional 10 FTL 5′ UTR mutants reported in Supplemental Figure 1C.

