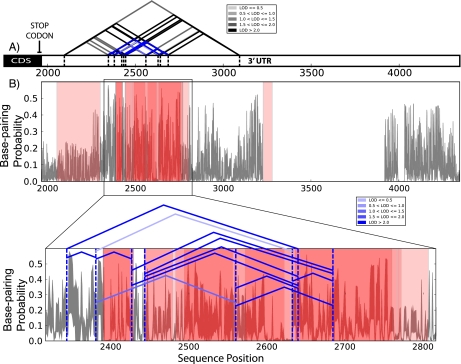
FIGURE 4.
SSH identified in the 3′ UTR of the RPA1 using SNPfold analysis. (A) Schematic representation of RPA1 3′ UTR including the coding sequence (CDS) and all currently known LD SNPs in the region, indicated as a triangle. The LOD scores of the SNPs are indicated in variable shades of gray and the subset of SNP pairs that stabilize structure are indicated in blue. (B) Mean change in base-pair probability based on a SNPfold analysis of the effects of individual SNPs that together stabilize structure. Red translucent bars indicate experimentally determined IGF2BP (insulin-like growth factor binding protein) binding sites (Hafner et al. 2010a; Rodriguez et al. 2010) on the 3′ UTR using the PAR-CLIP approach. The SSH (indicated with a series of solid blue angled lines) stabilizes a majority of IGF2BP binding sites, suggesting an important structural role for this region in the RPA1 3′ UTR. We report in Table 1 an additional 10 SSHs, eight of which stabilize known RBP sites.

