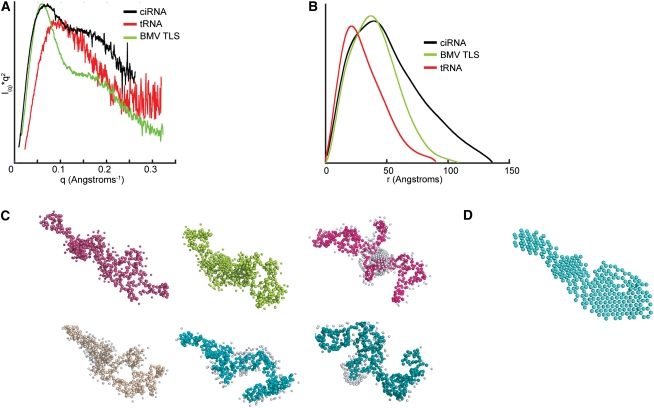
FIGURE 5.
Ab initio shape reconstructions of WT ciRNA from SAXS. (A) Kratky plots constructed from SAXS data of the ciRNA (black), phenyalanine yeast tRNA (red), and the BMV TLS RNA (green). The tRNA and BMV data and curves were previously published (Hammond et al. 2009). (B) Plots of the pairwise distribution functions for the same RNAs shown in panel A. Colors match panel A. (C) Six independent representative shape reconstructions. (D) Average of 10 independent reconstructions.

