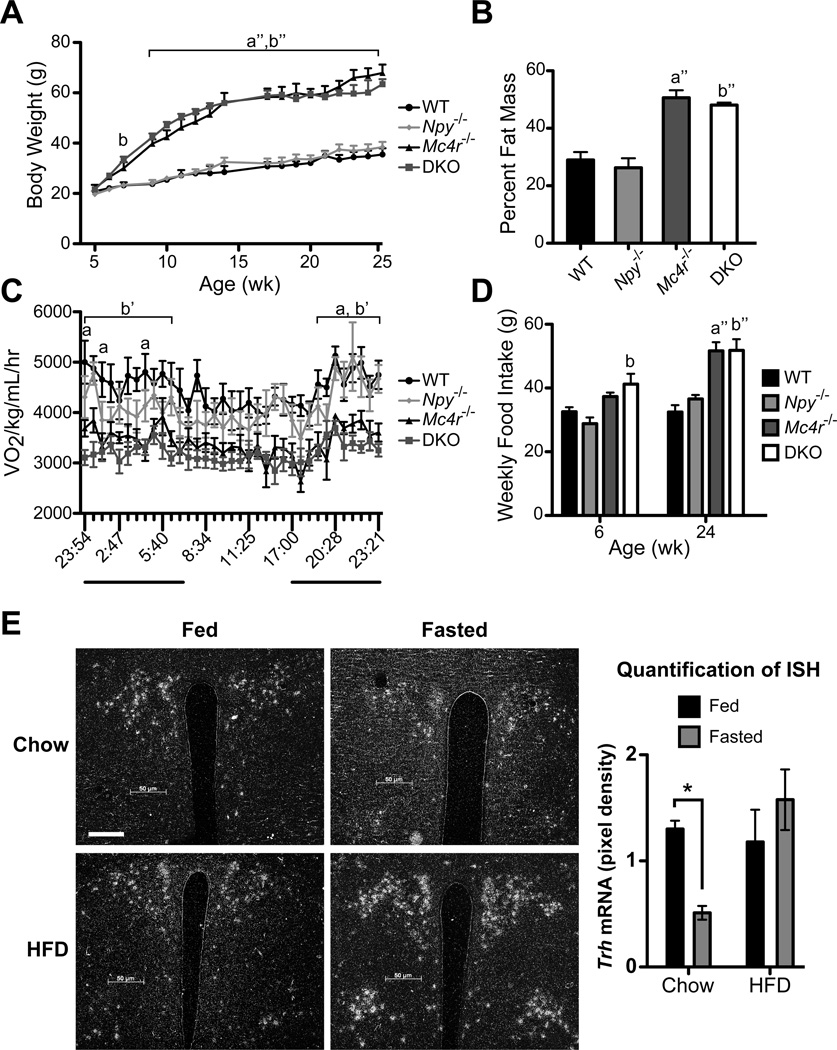
Figure 1. DKO mice have a similar metabolic phenotype as Mc4r−/− mice.
A, Average body weight of male WT, Npy−/−, Mc4r−/− and DKO mice from 5–25 wk of age. B, Percent fat mass as measured by DEXA. C, CLAMS: Mice were placed in a CLAMS apparatus and monitored for oxygen consumption (VO2) over a 24-hr period. The dark bars indicate dark period in the light cycle. D, Weekly food intake at 6 and 24 wk of age. A – D, data are presented as mean ± SEM. n = 6 per genotype. A, C – D were measured with repeated-measures 2-way ANOVA with Bonferroni post hoc test. B was measured with 1-way ANOVA with Tukey’s multiple comparison post hoc test. a = p < 0.05 Mc4r−/− versus WT and Npy−/−; a” = p < 0.001 Mc4r−/− versus WT and Npy−/−; b = p < 0.05 DKO versus WT and Npy−/−; b’ = p < 0.01 DKO versus WT and Npy−/−; b” = p < 0.001 DKO versus WT and Npy−/−. E, ISH was performed brain sections using a 35S-labeled riboprobe against mouse Trh mRNA. Representative images of fed and fasted C57Bl/6 mice on chow or HFD are shown of the PVN at original magnification, x10; scale bar, 50 µm. Quantification of Trh expression (right panel). Data are presented as relative pixel densities. Significance was tested by 2-way ANOVA with Bonferroni post hoc test (n = 4 per diet and fed status). Data are presented as mean ± SEM. * = p < 0.05. See also Figures S1 and S2.

