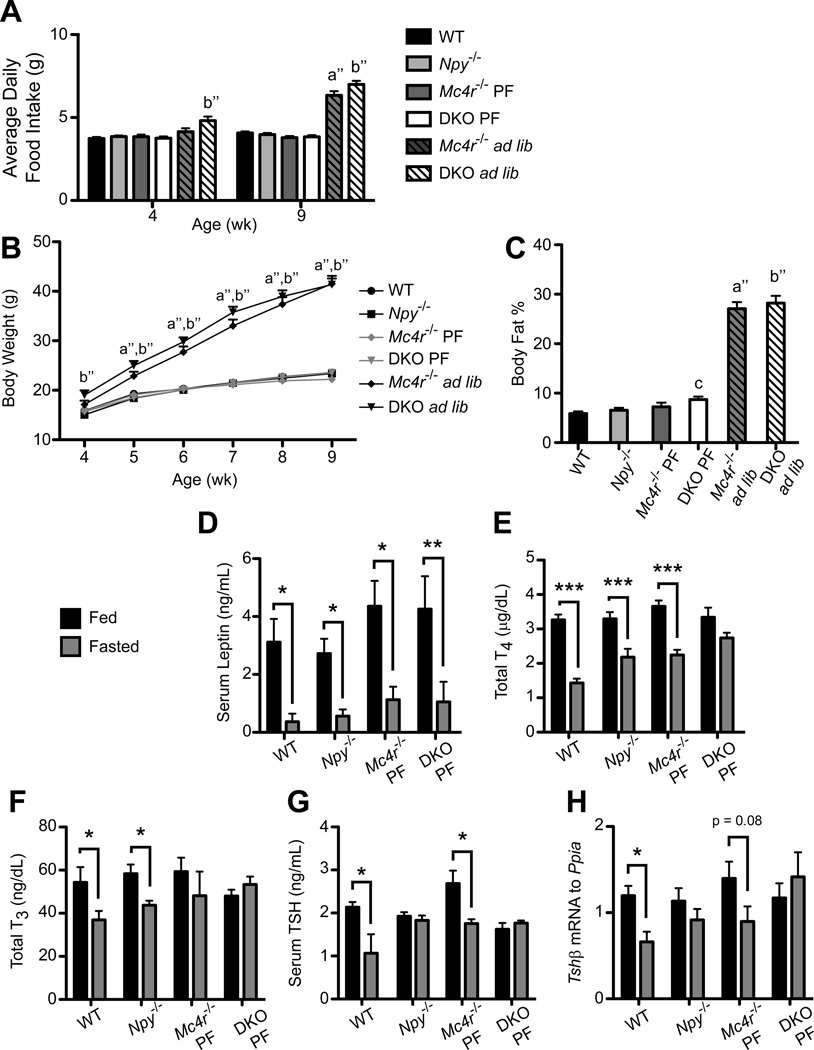
Figure 2. Pair-fed mice lacking both NPY and MC4R fail to suppress thyroid hormone and TSH levels.
Average daily food intake (A), Body Weight (B) and Body Fat percentage (C) of combined NPY/MC4R cohorts 2 and 3: WT (n = 40), Npy−/− (n = 38), pair-fed Mc4r−/− (Mc4r−/− PF; n = 20) and DKO (DKO PF; n = 28), and ad libitum Mc4r−/− (Mc4r−/− ad lib; n = 11) and DKO (DKO ad lib; n = 12) mice. A, B were analyzed by repeated-measures 2-way ANOVA with Bonferroni post hoc test. C was analyzed via 1-way ANOVA with Tukey’s multiple comparison post hoc test. For A–C, data are presented as mean ± SEM. a” = p < 0.001 Mc4r−/− ad lib versus WT, Npy−/−, Mc4r−/− PF and DKO PF; b” = p < 0.001 DKO ad lib versus WT, Npy−/−, Mc4r−/− PF and DKO PF; c = p < 0.05 DKO PF versus WT. D, Serum leptin levels were measured in cohort 2 fed and fasted WT (n = 5, n = 7), Npy−/− (n = 10, n = 10), Mc4r−/− PF (n = 4, n = 4), and DKO PF (n = 6, n = 5) mice. E, Combined cohort 2 and 3 Total T4 (TT4) levels of fed and fasted WT (n = 23, n = 17), Npy−/− (n = 21, n = 17), Mc4r−/− PF (n = 10, n = 10), and DKO PF (n = 16, n = 12) mice. F, Total T3 (TT3) concentration of cohort 2 WT (n = 5, n = 7), Npy−/− (n = 10, n = 10), Mc4r−/− PF (n = 4, n = 4), and DKO PF (n = 6, n = 5) mice. G, Serum TSH concentration of cohort 2 WT (n = 4, n = 4), Npy−/− (n = 10, n = 10), Mc4r−/− PF (n = 3, n = 3), and DKO PF (n = 6, n = 5) mice. H, Tshβ levels relative to the control gene Ppia (cyclophilin) were measured via QPCR in cohort 3 WT (n = 18, n = 11), Npy−/− (n = 10, n = 8), Mc4r−/− PF (n = 7, n = 7), and DKO PF (n = 9, n = 7) mice. For D–H, data are presented as mean ± SEM. Significance was measured with 2-way ANOVA with Bonferroni post hoc test. * = p < 0.05; ** = p < 0.01; *** = p < 0.001. See also Figure S3.

