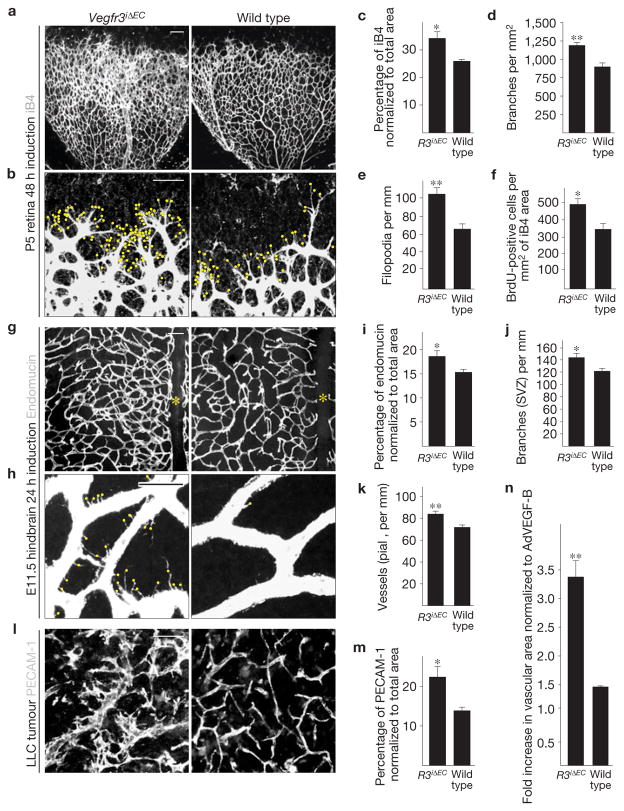
Figure 1.
Blood vascular hyperplasia and excessive filopodia projection in mice with a targeted deletion of Vegfr3 in the endothelium. (a,b) Visualization of blood vessels by isolectin B4 (iB4) staining of Vegfr3iΔEC and wild-type littermate retinas at P5. Yellow dots indicate filopodia at the vascular front in b. Scale bars, 100 μm (a) and 50 μm (b). (c–f) Quantitative analysis of the retinas shown in a and b. (c) iB4-positive surface area normalized to total area. (d) Number of vessel branching points. (e) Number of filopodia per length of vascular front. (f) BrdU-positive cells per iB4 area (see Supplementary Fig. S2). In all cases, Cre activity was induced for 48 h before the mice were killed. c–e show data from one litter containing 5 Vegfr3iΔEC and 3 wild-type mice. (f) Data from one litter containing 3 Vegfr3iΔEC and 4 wild-type mice. (g,h) Endomucin staining of E11.5 mouse hindbrains after Cre induction for 24 h before the mice were killed. Yellow asterisks indicate the hindbrain midline in g, and yellow dots indicate filopodia in h. Scale bars, 100 μm (g) and 20 μm (h). (i–k) Quantitative analysis of the Vegfr3iΔEC and wild-type hindbrains; n =3 Vegfr3iΔEC and 5 wild-type embryos. (i) Endomucin-positive surface area normalized to total area. (j) Number of vessel branching points in the subventricular side. (k) Number of vessel sprouts in the pial side (see Supplementary Fig. S3). (l) PECAM-1 staining of LLC tumour xenografts 11 days after implantation into Vegfr3iΔEC or wild-type littermate mice. Scale bar, 50 μm. (m) Quantification of PECAM-1-positive area in the tumours shown in l; n = 5 Vegfr3iΔEC and 5 wild-type mice. (n) Fold increase in vascular area 4 days after transduction with adenoviral vectors encoding VEGF (AdVEGF), normalized to AdVEGF-B in Vegfr3iΔEC versus wild-type mice (see Supplementary Fig. S4); n =3 ears per group. **P <0.005, *P <0.05. Error bars, s.e.m.

