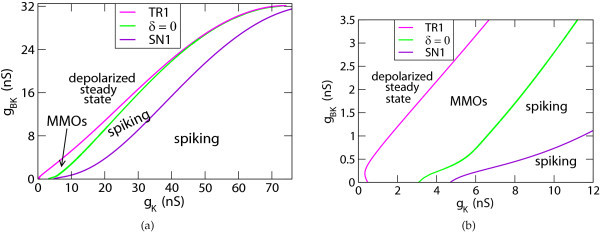
Figure 11.
(a) Mixed mode oscillation borders for Cm → 0. The region of mixed mode oscillations (MMOs) is bounded by the two curves TR1 and δ = 0. Steady state and spiking solutions occur to the left of the TR1 curve and to the right of the δ = 0 curve, respectively. (b) Magnification of panel (a) for a smaller range of values of gK and gBK.

