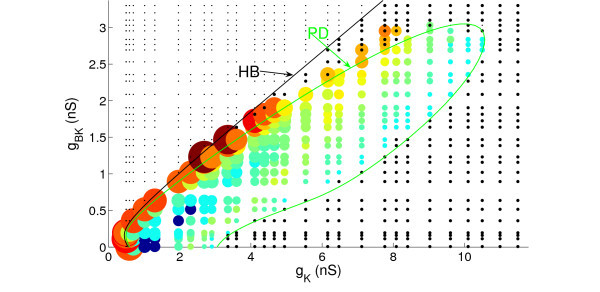
Figure 12.
The active phase duration and the number of spikes per burst of the full system for Cm = 5 pF. The system displays steady state, spiking or bursting solutions. Steady state and spiking solutions are represented by black dots and small black circles, respectively. The bursting region is bounded by the supercritical Hopf bifurcation (HB, black) and the right branch of the period doubling (PD, green) curves. The bursting patterns in this region are represented by colored circles. The size of a circle represents the active phase duration, with larger circles corresponding to longer active phase durations. The color of a circle represents the number of spikes per burst. Cyan circles correspond to smaller number of spikes per burst (minimum of two spikes) and the largest dark red circle corresponds to the largest number of spike per burst (36 spikes in a burst).

