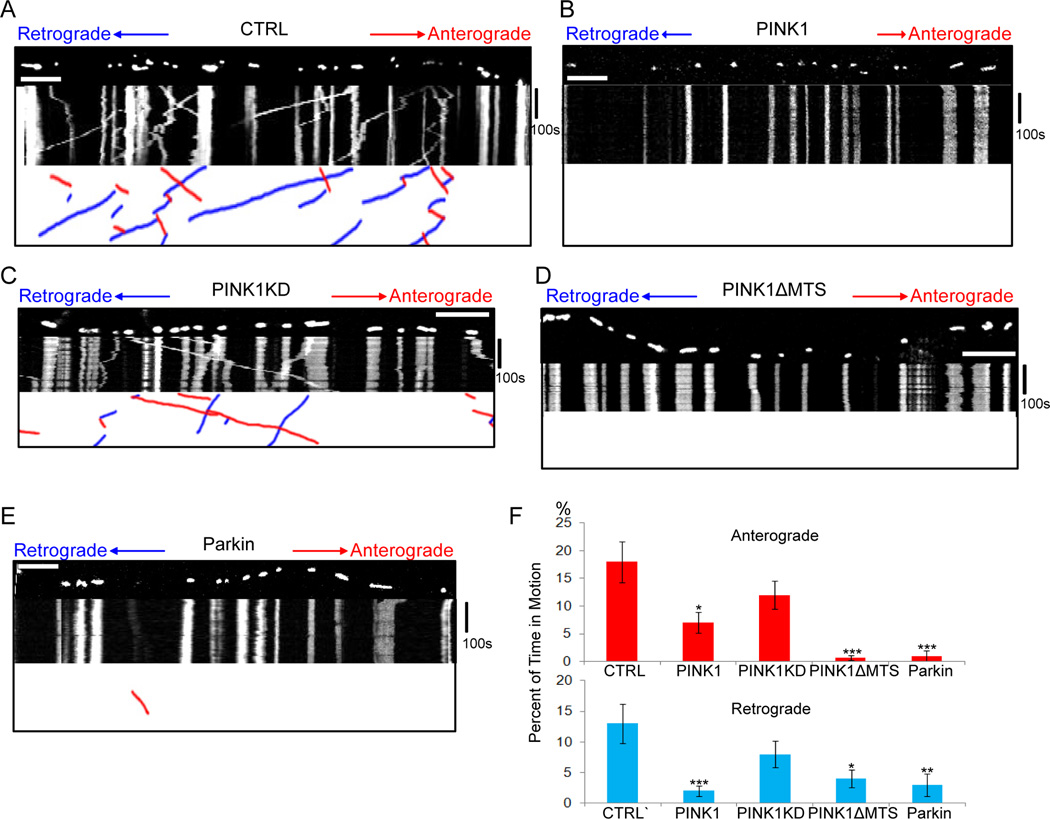
Figure 1. PINK1 or Parkin Overexpression Arrests Mitochondria in Rat Hippocampal Axons.
(A–E) Mitochondrial movement in representative axons transfected with mito-dsRed. The first frame of each live-imaging series is shown above a kymograph generated from the movie. The x axis of each represents mitochondrial position and the y axis is time (moving from top to bottom). Vertical white lines correspond to stationary mitochondria and diagonal lines are moving mitochondria. To illustrate the interpretation of kymographs, the lower panels extract only the moving mitochondria, which are shown as red (anterograde) or blue (retrograde) diagonal lines. Axons were tranfected with mito-dsRed alone (A), or together with PINK1-Flag (B), kinase-dead PINK1 (PINK1KD-Flag) (C), PINK1ΔMTS-Flag (D), or YFP-Parkin (E). (F) From kymographs as in (A–E), the percent of time each mitochondrion was in motion was determined and averaged. n=81–136 mitochondria from 8 axons and 4 separate transfections per genotype. * P<0.05, ** P<0.01, *** P<0.001, and error bars represent mean±S.E.M. here and for all figures unless otherwise stated. Scale bars, 10 µm. See also Figure S1, Movies S1, and Tables S1.

