
Table 7.
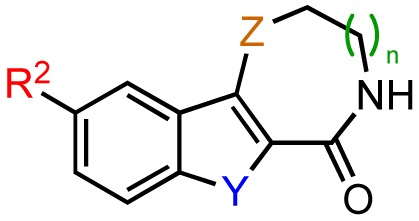
Chemical structures and PKD1 inhibitory activities of zone II and III modifications.
| ||||||||
|---|---|---|---|---|---|---|---|---|
|
| ||||||||
| Entry | Compound | Structure | IC50 | |||||
|
|
|
|||||||
| Y | Z | R2 | n | % PKD1 activity at 1 μM | Radiometric PKD1 (μM)a | Cellular PKD1 (μM)b | ||
| 1 | kb-NB184-22 | S=O | S | OH | 1 | 66.5 ± 6.1 (n = 2) | n.d. | n.d. |
| 2 | kb-NB184-25 | S=O | S | OMe | 1 | 50.4 ± 2.3 (n = 2) | 1.08 (n = 1) | n.d. |
| 3 | kb-NB184-45 | S | S=O | OMe | 1 | 97 ± 16 (n = 2) | n.d. | n.d. |
| 4 | kb-NB165-89 | S | S | OBn | 2 | 84.3 (n = 1) | 21.7 (n = 1) | n.d. |
| 5 | kb-NB165-92 | S | S | OH | 2 | 16.7 (n = 1) | 0.11 ± 0.01 (n = 3) | 2.56 ± 0.66 (n = 2) |
| 6 | kb-NB184-02 | S | S | OMe | 2 | 29.5 (n = 1) | 0.19 ± 0.03 (n = 3) | 18.6 ± 2.0 (n = 3) |
| 7 | kb-NB184-36 | S | O | OBn | 2 | 83.3 ± 3.8 (n = 2) | n.d. | n.d. |
| 8 | kb-NB184-57 | S | O | OMe | 2 | 62.0 ± 3.5 (n = 2) | n.d. | n.d. |
| 9 | kb-NB184-80 |
|
91.3 ± 1.5 (n = 2) | not inhibitory | n.d. | |||
a
PKD1 IC50 was determined using a radiometric kinase activity assay as previously described [52]. Each IC50 was calculated as the mean ± SEM with triplicate determinations at each concentration in each experiment; n = number of independent experiments.
b
Cellular IC50 was determined by densitometry analysis of Western blotting data for PKD1 autophosphorylation at S916 in LNCaP cells as previously described [53]. Each IC50 was calculated as the mean ± SEM of at least two independent experiments; n = number of independent experiments.