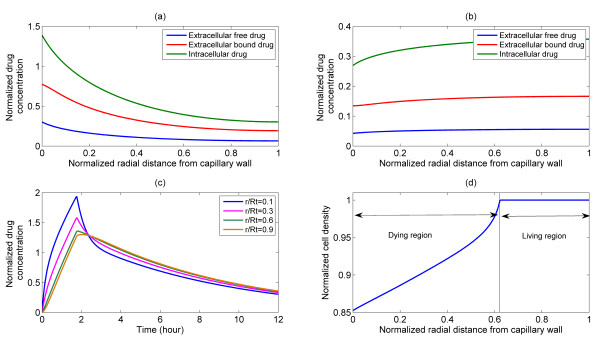
Figure 3.
Representative plots of spatial and temporal distributions of drug and cell density following a pulse injection for bistable switch. Upper panel: Intracellular and extracellular drug distribution in the tumour cord under pulse injection, S = 4, T = 1.75 h, profiles shown at (a) 30 min, (b) 12 h. Bottom left: (c) time course of intracellular drug distribution at various radial positions. Bottom right: (d) spatial profile of cell density at 12 h, revealing cell death and living regions in the front and rear of the tumour cord.

