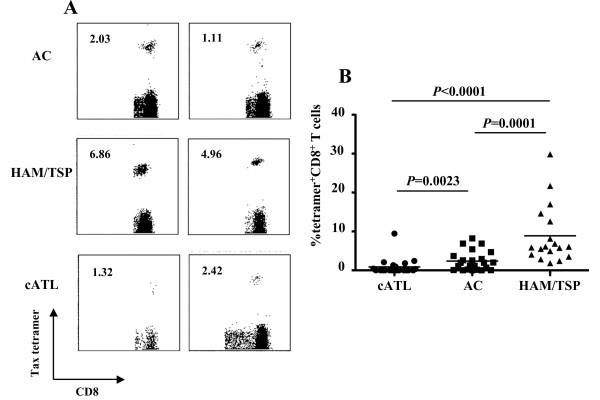
Figure 1.
Incidence and frequency of Tax-specific CD8+ T-cells in ACs, and HAM/TSP and cATL patients. (A) Whole blood or PBMCs from AC (top), and HAM/TSP (middle) and cATL (bottom) patients were stained with Tax/HLA tetramer. Number indicates the percentage of tetramer+ cells in CD8+ T-cells. (B) The percentage of Tax-tetramer+ CD8+ T-cells in AC (n = 23), and HAM/TSP (n = 18) and cATL (n = 21) patients. P value was determined by the Mann-Whitney U test. Horizontal bars indicate the average percentage of Tax-tetramer+ CD8+ T-cells for the group.

