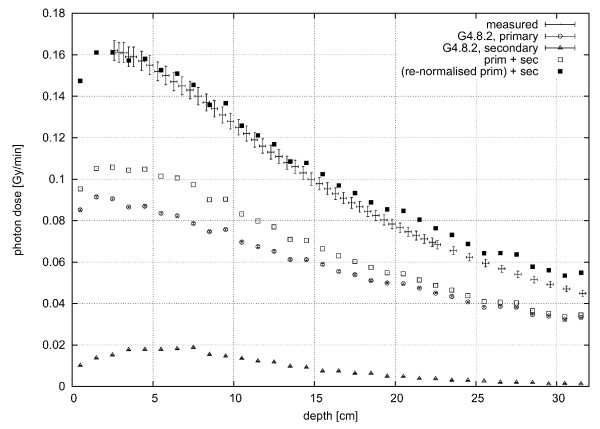
Figure 6.
Primary and Secondary Photon Dose Rate. Primary and secondary photon dose rate calculated in the solid-box water phantom (error bars provide one standard deviation as calculated in GEANT4), in comparison to measured [30] data (beam profile of 9 × 9 cm2); □ = total dose rate from primary (Δ) and secondary (○) photons; ■ = total dose rate from the re-normalized dose rate of primary photons together with that of the secondary photons. Note that while the absolute uncertainties seem to decrease with depth, the relative uncertainties increase with depth.

