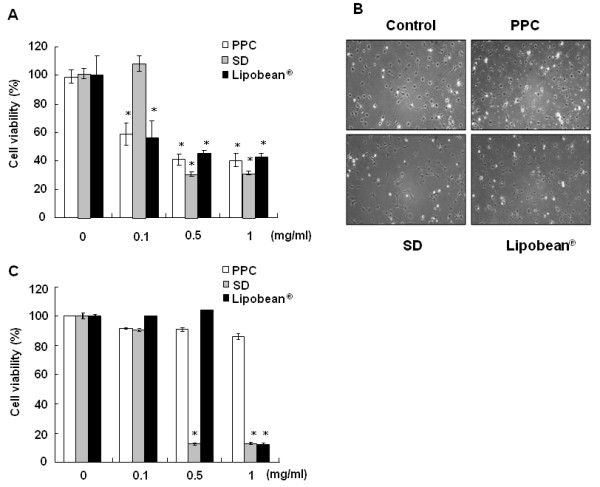
Figure 1.

Effects of PPC on cell viabilities. (A) 3TC-L1 cells were treated with PPC, SD, Lipobean® at 0-1 mg/ml. (B) Morphology of 3T3-L1 cells after 0.1 mg/ml of PPC, SD, Lipobean® treatment. Phase contrast photographs were taken using a digital video camera. (C) CCD-25Sk human fibroblasts were treated with PPC, SD, Lipobean® at 0-1 mg/ml. After 24 h, cell viability was measured by MTT assay. The data represent the mean ± standard deviation (S.D.) of triplicate assays expressed as percentages of the control. Each experiment was repeated independently at least twice, and the representative results are shown. * P < 0.01 compared to the untreated control.
