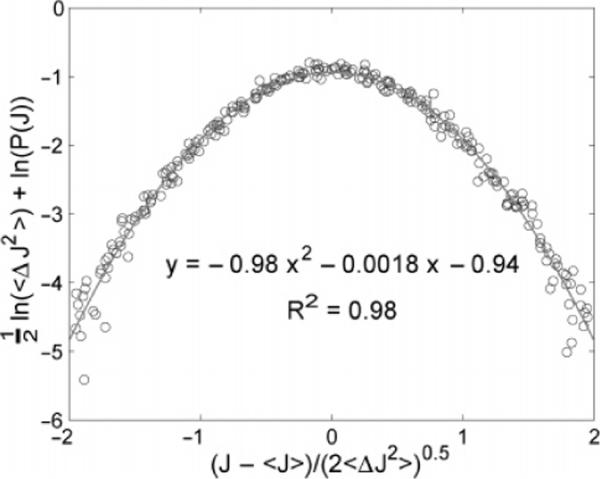
Figure 2.
Flux distribution function. ½ ln(〈(ΔJ)2〉) + ln(P(J)) is plotted against (, based on the form indicated by eq 3. The circles indicate experimental points, and the line shows a quadratic fit to the data. The coefficient of determination, R2, for the fit is also reported. This demonstrates that the distribution function is Gaussian, and we find that the coefficients are well predicted by eq 3.

