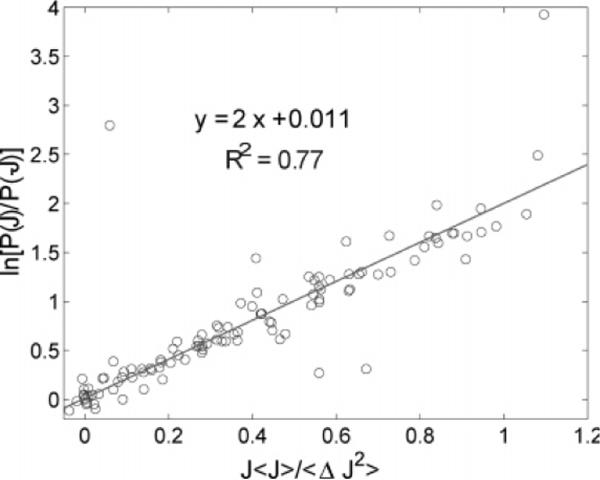
Figure 4.
Flux fluctuation theorem. The plot shows ln[P(J)/P(−J)] vs 〈J〉J/〈(ΔJ)2〉 for different values of 〈J〉 and 〈(ΔJ)2〉 arising due to different combinations of N1 and N2. Experimental data are shown in circles, while the solid line represents the fit to the data. The coefficient of determination, R2, for the fit is also reported. The slope and intercept agree with the prediction of eq 7.

