
Figure 6.
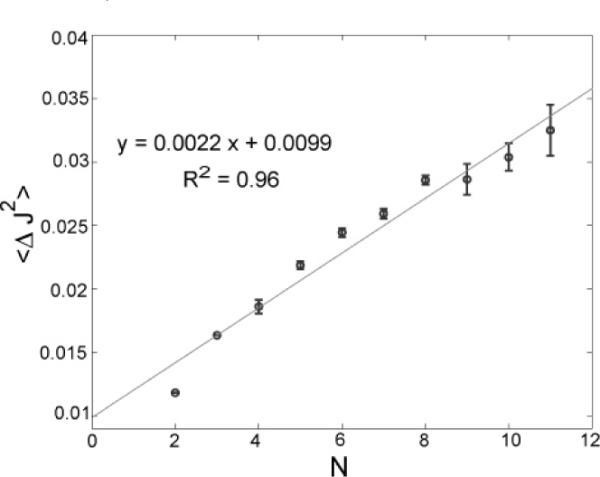
Second cumulant, 〈ΔJ2〉) 〈J2〉 − 〈J〉2, vs the total number of particles, N. The second moment of particle flux is proportional to the sum of particle numbers in the two bins. Experimental data are shown in circles, while the solid line represents the fit to the data. The coefficient of determination, R2, for the fit is also reported. The error bars show the variances due to the different combinations of N1 and N2 that result in the same N value. The slope and intercept are well predicted by eq 5.