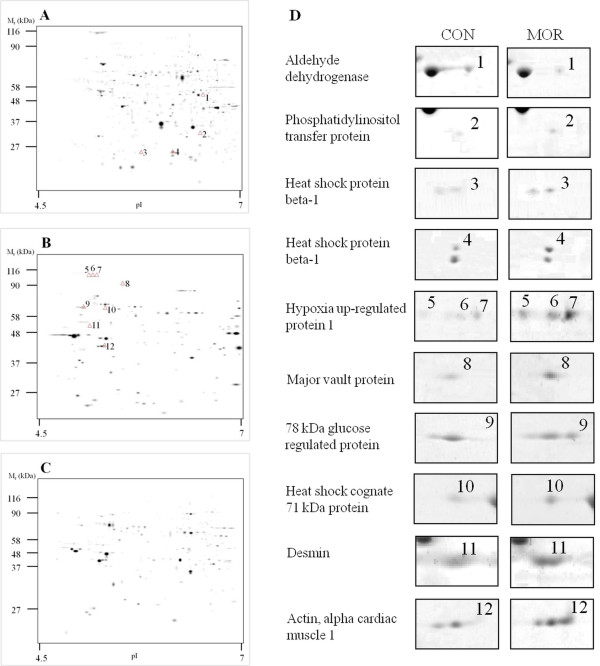
Figure 2.
Two-dimensional protein profiles of myocardial tissue. Representative gel images of the cytosolic (A), plasma membrane-enriched (B) and mitochondrial (C) fractions stained with SYPRO Ruby are displayed. The positions of molecular weight markers are indicated to the left and the pI at the bottom of each panel. The protein spots with markedly different densities in myocardial preparations from control and morphine-treated rats are numbered from 1 to 12 and the respective portions of 2D gels are shown in greater magnification in panel D. The corresponding identifications are listed in Table 1. Two spots were detected for heat shock protein beta-1 (No. 3 and 4) and three spots for hypoxia up-regulated protein 1 (No. 5-7), possibly due to post-translational modifications.

