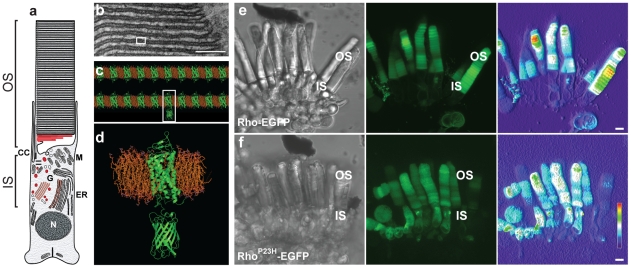
Figure 1. Expression of RhoP23H-EGFP in transgenic Xenopus.
(a) Schematic drawing (left) of the Xenopus rod photoreceptor. The inner (IS) and outer (OS) segments, the nucleus (N), the prominent endoplasmic reticulum (ER), Golgi (G), connecting cilium (CC) and mitochondria (M) located apically in the IS are shown. The OS contains numerous stacks of disk membranes. (b) A segment of OS is shown in an electron micrograph. Scale bar, 100 nm. (c) A molecular model of the OS disk membrane (from a segment of a single disk, white box in b). The density of rhodopsin, approximately 90% of the protein in the OS disk membranes [32] is illustrated to scale in the molecular homology model based upon the high-resolution bovine rhodopsin structure [33]. The rhodopsin-phospholipid molar ratio is presented to scale. (e, f) Representative images of sections of live Xenopus retina showing rod cells expressing either Rho-EGFP (e) or RhoP23H-EGFP (f) The DIC image of a small piece of retina (left) and the corresponding three dimensional rendering of a confocal laser scanning z-stack using EGFP detection (middle) are shown. The outer and inner segments are labeled. To illustrate the range of transgene expression, a concentration heat map (red, maximum intensity) is shown (right). Scale bar, 5 µm.

