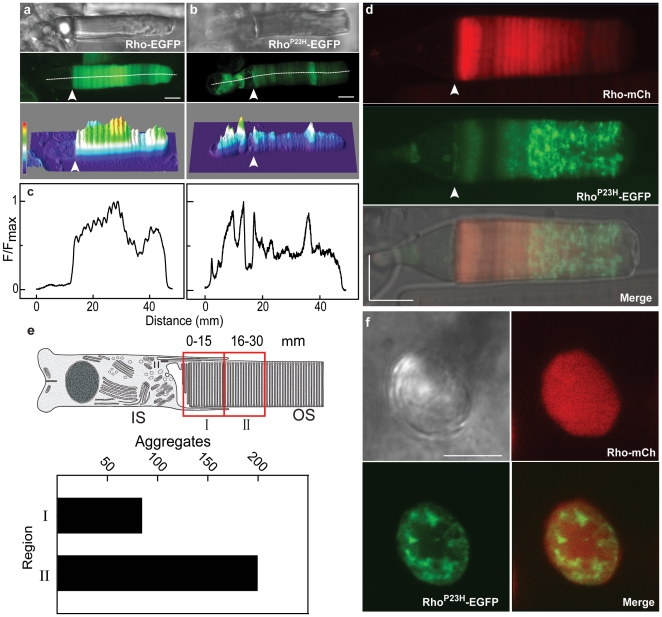
Figure 2. Aberrant expression and aggregation of RhoP23H-EGFP in rod photoreceptors.
Confocal images of representative live cells expressing rhodopsin-EGFP fusion proteins show distributions of Rho-EGFP (a) and mutant opsin, RhoP23H-EGFP (b). DIC (top) and fluorescence (middle) images were used to calculate the fluorescence distribution, displayed as a heat map (bottom): red for most intense, green for mid-level and blue for least intense. The border between the IS and OS is indicated by the arrow. (c) The fluorescence profile distribution was computed along the z-spline path through the center of the cell (white line), with the origin arbitrarily set in the nuclear region for each cell. The fluorescence intensity was normalized to the maximum value along the spline. (d) High resolution images of a representative live rod expressing fluorescent protein from two rhodopsin cassettes: Rho-mCherry (red, encoding wild type opsin) and RhoP23H-EGFP (green). The fluorescence intensity profile of two transgenes was determined simultaneously, and the individual distributions (mCherry, top and EGFP, middle are shown together with the distributions merged onto a DIC image (bottom). (e) Quantification of the fluorescent foci in two OS axial locations in live rods expressing RhoP23H-EGFP. The OS was divided into two sections (I and II), comprising ∼60% of the length. The more distal region of the OS was not included to avoid regions prone to swelling or other in vitro damage. The number of isolated fluorescent foci in the outer segment regions was counted in a total of 27 cells from 16 transgenic tadpoles expressing RhoP23H-EGFP. (f) Representative cross-sectional view of an OS from a live rod expressing two rhodopsin cassettes: Rho-mCherry and RhoP23H-EGFP. The z-section for the CSLM was parallel to the rod axis, and the fluorescence from each channel is shown separately and merged. Scale bars, 5 µm.

