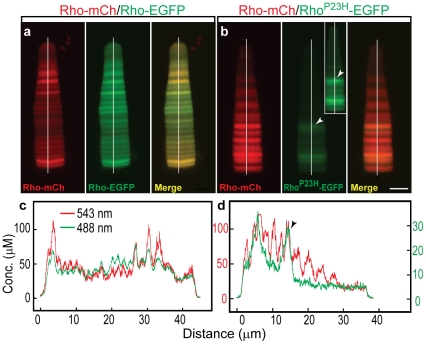
Figure 3. Quantification of transgene expression from dual rhodopsin cassettes in Xenopus rods.
(a, b) Measurement of the EGFP and mCherry fluorescence distributions in cells expressing Rho-mCherry/Rho-EGFP (a) and Rho-mCherry-RhoP23H-EGFP (b). Control rods with no fluorescent protein had only background fluorescence which was set to zero. Images show the mCherry (red), EGFP (green) and merged distributions for representative rods. The merged image (a, right) shows synchronized changes in the expression level of both transgenes (Rho- EGFP and Rho-mCherry). The concentration of both proteins is comparable along the rod axis. (b) The RhoP23H-EGFP expression level is significantly lower (b, middle) than the co-expressed wild type Rho-mCherry (b, left). The inset in panel (b, middle) shows the intensified EGFP channel of the original figure to clarify its profile. (c, d) Distributions were measured along the central axis of the cell (white line), converted to concentration using the calibration in Fig. S3 and plotted as a function of distance from the OS base. The dual wild type cassettes are shown in (c) at the same scale for both green and red channels, while for the dual cassette containing RhoP23HEGFP (d), the EGFP values (green) are given on right Y-axis (green) and the mCherry values (red) on left Y-axis. The distance is measured from the base of the rod OS. The arrowhead indicates fluorescent foci in the RhoP23H-EGFP rod. Scale bar, 5 µm.

