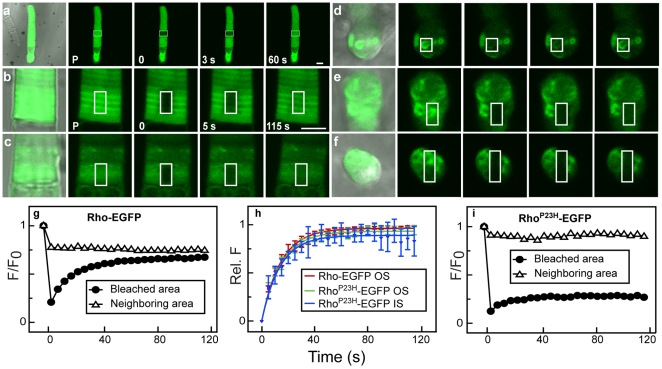
Figure 4. Aberrant mobility of RhoP23H-EGFP measured using fluorescence recovery after photobleaching.
(a) Representative low magnification CSLM images of a live rod expressing soluble EGFP show the fluorescence distribution (merged with the DIC image, left) and with the region of interest (ROI) indicated (white box). The cell (P, pretreatment) was photobleached in the ROI (0 s) and the recovery was followed for the indicated time (in seconds). (b–f) Live rods expressing Rho-EGFP or RhoP23H-EGFP were photobleached in different regions and images from different times in the recovery period are shown at higher magnification. The pre-bleach sample is shown as a merge (fluorescence with DIC, left) and with fluorescence alone (P) followed by representative images immediately after bleach (0 s) and 5 s and 115 s post-bleach. The ROI is boxed in each image. Various compartments of the cells were photobleached: (b) base of the OS in cells expressing Rho-EGFP; (c) near the base of the OS in a region with no fluorescent foci in a cell expressing RhoP23H-EGFP; (d) IS in a cell expressing RhoP23H-EGFP; (e) in the OS with fluorescent RhoP23H-EGFP foci; (f) in an axial view of the OS with fluorescent RhoP23H-EGFP foci. (g) The photobleaching recovery profile of panel (b). Integrated fluorescence of Rho-EGFP in the ROI defined in (b), normalized to the integrated fluorescence of the same region in the pre-photobleached image (closed circles) compared to the fluorescence in a neighboring region (open triangles). (h) Integrated fluorescence recovery after photobleaching in regions of RhoP23H-EGFP that showed recovery following photobleaching (c and d). Averaged recovery profiles of photobleached areas in the two groups (c and d) were normalized in order to compare the half-time recovery of the mobile fraction of mutant opsin participating in recovery after photobleaching. Rho-EGFP (red trace) is included for comparison. (i) The photobleaching recovery profile of panel (e) from the ROI (closed circles) and a neighboring area (open triangles). There is no significant change in the fluorescence of the foci on the left of photobleaching box during the recovery period (open triangles). Scale bars, 5 µm.

