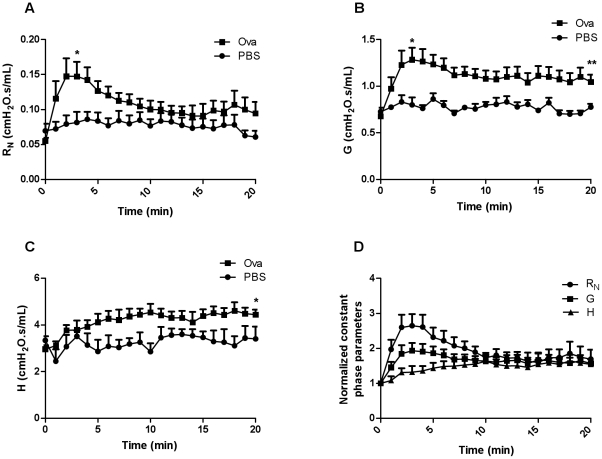
Figure 1. RN, G, and H over the 20 minute period following aerosol challenge with PBS or Ova and normalized constant phase parameters over time in Ova-challenged animals.
(A) RN and (B) G are significantly different following Ova challenge than their respective controls (n = 6−8/group) at 3 minutes while (B, C) G and H are markedly higher than controls at 20 minutes. (D) Illustration of normalized parameters for the Ova-challenged animals (*p<0.05, **p<0.01).

