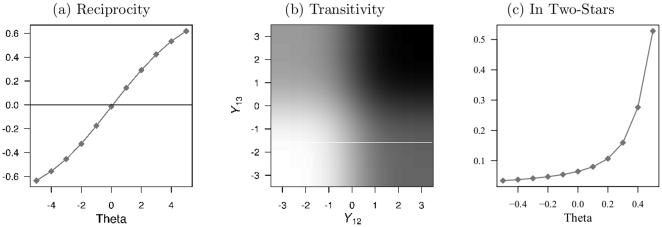
Figure 4. Dependence statistics in a 25 vertex network .
 with a standard normal
 . The Y-axis in (a) is the Pearson's correlation coefficient between edges in a dyad. The transitivity graphic in (b) is shaded to reflect the mean value of
  , with darker values indicating higher values. The parameter value is set to 1. The Y-axis in plot (c) depicts the variance in the in-degrees across vertices.

