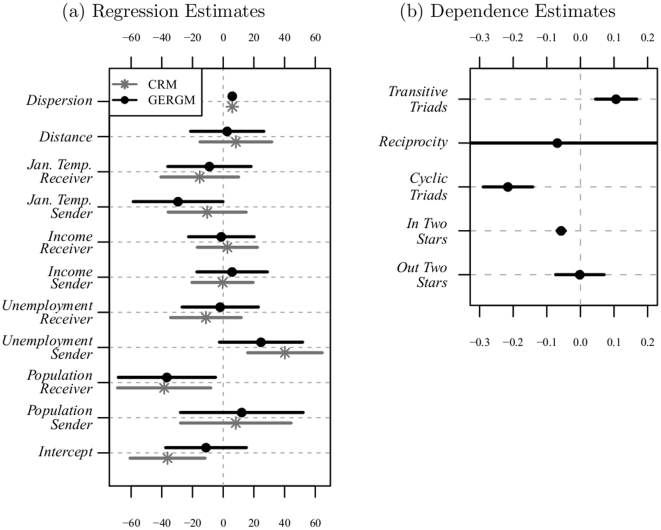
Figure 5. Estimates of the parameters for covariates (cell a) and dependence terms (cell b).
The coefficients are depicted as points whose values are captured by their location on the x-axis. The bars spanning from each point are 95% confidence intervals based on 5,000 draws for three iterations used in the MCMC-MLE. Confidence intervals not including zero are statistically significant at the traditional 0.05 level. Points and lines in black refer to our Cauchy GERGM, those in grey refer to the CRM.

