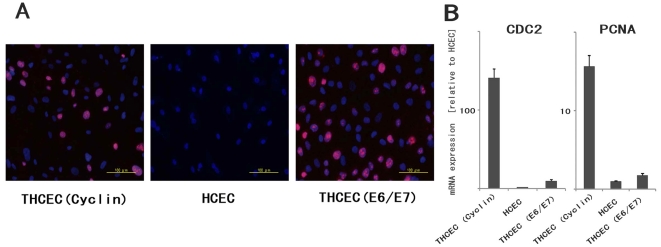
Figure 2. Evaluation of proliferative capacity.
(A) Immunohistochemistry of Ki-67 in three cell lines. Positive staining of Ki-67, located in the nucleus, was obviously identified in THCEC (Cyclin) and THCEC (E6/E7), but rarely detected in HCEC. (B) Real-time PCR of downstream genes of cyclinD1 associated with proliferation. Gene expression levels of both CDC2 and PCAN were clearly higher than that of HCEC. The gene expression was much more activated in THCEC (Cyclin) in which the expression of E2F, an upstream transcriptional factor of two genes, was constitutively activated by transduced mutant Cdk4 and CyclinD1.

