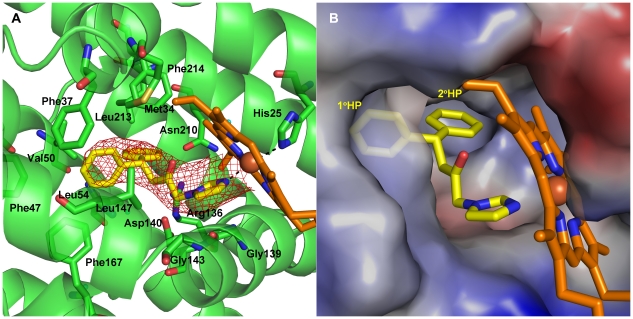
Figure 6. Crystal structure of heme–conjugated hHO-1 in complex with QC-308 at 2.85 Å resolution.
(A) Ribbon diagram of the inhibitor binding site. Heme (orange) and QC-308 (yellow) are depicted as stick models. An omit map (Fo-Fc) contoured at 2σ is superimposed. Dashed lines indicate coordination of imidazole nitrogens of QC-308 and His25 with the heme Fe. Residues involved in inhibitor binding are indicated. (B) Electrostatic surface potentials revealing the presence of two distal hydrophobic pockets (1° HP and 2° HP) which accommodate the two phenyl groups of QC-308: a “double-clamp”. Dashes indicate coordination of the imidazole group with the heme Fe. Blue and red colours indicate positive and negative electrostatic potentials, respectively, as calculated using PyMOL [60].

