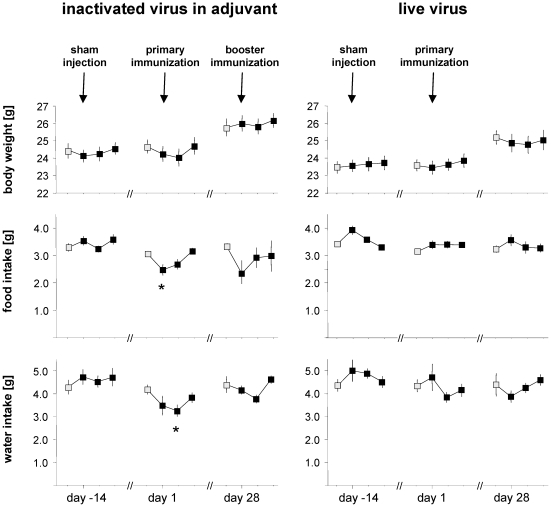
Figure 2. Changes in body weight, and food and water intake.
Data were plotted over four days at sham injection, primary and booster immunization. The first data point of each series represents baseline values taken the day before an intraperitoneal injection (grey-filled symbols). Symbols indicate daily mean of eight mice per protocol, bars indicate SEM. Asterisks indicate statistical significance with p≤0.01.

