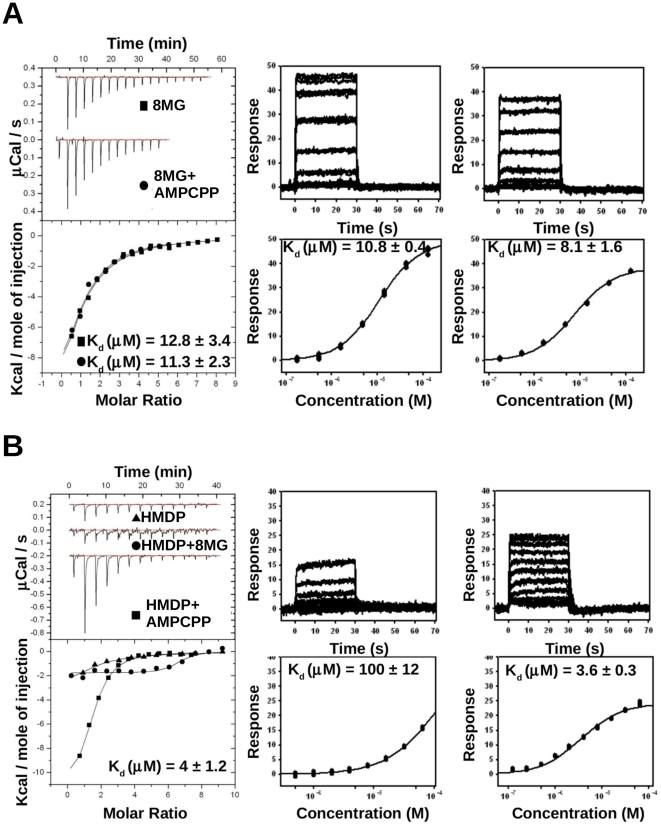
Figure 4. Binding of ligands to SaHPPK as measured by ITC and SPR.
A, Raw (top left) and integrated ITC data (bottom left) for the titration of 30 µM SaHPPK with 300 µM 8-mercaptoguanine (8MG) alone (▪), and 300 µM 8-mercaptoguanine in the presence of 1 mM AMPCPP (•). SPR raw data (middle and right top) and steady-state response curve (middle and right bottom) for the binding of 8-mercaptoguanine in the absence (middle) and presence (right) of 5 mM ATP. B, Raw ITC data (top left) and integrated normalised data (bottom left) for titrations of 22 µM SaHPPK with 500 µM HMDP (▴) in the absence of 8-mercaptoguanine and in the presence of 300 µM 8-mercaptoguanine (•), and in the presence of 1 mM AMPCPP (▪). Binding of HMDP was only detected in the presence of AMPCPP. SPR raw data (middle and right top) and steady-state response curve (middle and right bottom) for the binding of HMDP in the absence or presence of saturated AMPCPP.

