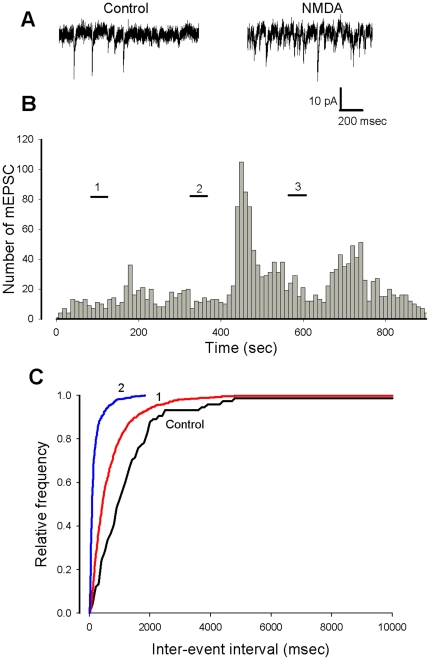
Figure 6. Repetitive applications of NMDA promote the facilitatory effect on mEPSC frequency.
A. Current traces showing mEPSCs before (left) and after (right) a second application of NMDA. B (same cell as in A). Histogram representing the number of mEPSCs as a function of recording time (bin 10 s). During the short horizontal bars NMDA is applied at 10−5 M (bars 1 and 2) and at 5×10⁻⁶ M. (bar 3). C. Cumulative plots of inter-event intervals in control conditions (black curve) in the presence of NMDA after the first application (1, red curves) and second application (2, blue curve).

