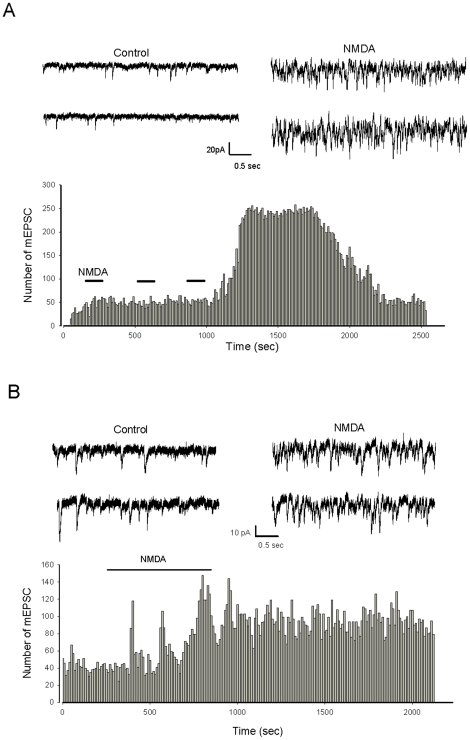
Figure 7. NMDA increases the frequency of mEPSCs in Purkinje cells recorded in acute slices prepared from P15–16 mice.
A, B. Upper panels illustrate current traces recorded at −60 mV in the presence of TTX and Gabazine before (left) and after NMDA application (right). Lower panels show histograms representing the number of mEPSC as a function of recording time (bin 10 s). NMDA 10−4 M is applied as indicated by the horizontal bars. Note in A that the NMDA effect on mEPSC frequency is observed after the third application of NMDA, whereas in B the response is observed after a long-lasting (10 minute) application of NMDA.

