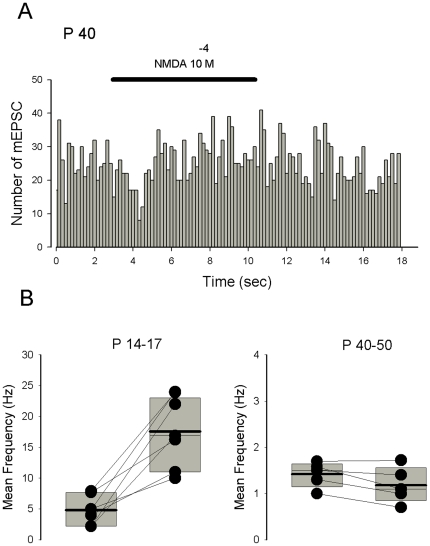
Figure 8. The effect of NMDA on mEPSC frequency is seen in juvenile but not adult mice.
A. Histogram representing the number of mEPSCs recorded in a Purkinje cell from a slice prepared from a P40 mouse as a function of recording time (bin 10 s). During the horizontal bars NMDA is applied at 5×10⁻⁴ Note the absence of NMDA effect on mEPSC frequency. B. The effect of NMDA on mEPSC mean frequency recorded in Purkinje cell from acute slices prepared with juvenile (left, 7 cells) and adult mice (right, 5 cells). A representation with box plots indicating the mean values (thick line) and median values (thin line) has been adopted because of the non-normal distribution of frequency values. The bottom and the top of the box represent the 25th and 75 th percentile respectively.

