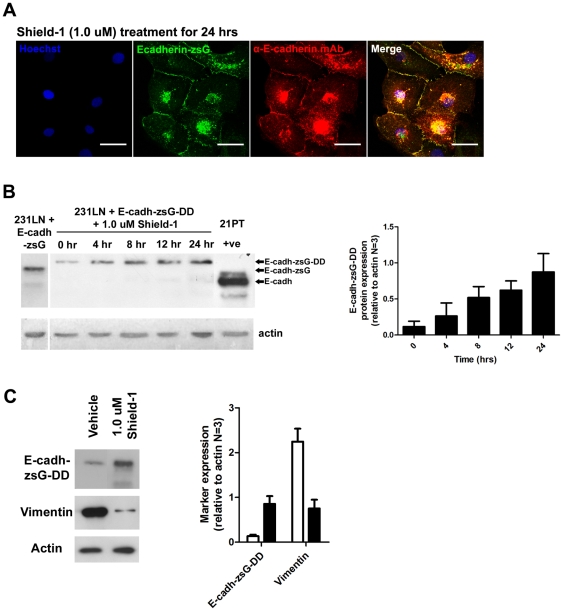
Figure 4. Induction of E-cadherin-zsG-DD protein in 231LN cells by Shield-1 ligand and expression of vimentin.
A) 231LN cells expressing E-cadh-zsG-DD (green) treated with 1.0 µM Shield-1 for 24 hours and immunostained with anti-E-cadherin mAb (red) and Hoechst nuclear stain (blue). Scale bars are 25 µm. B) Western immunoblot analysis of E-cadherin expression in 231LN cells expressing E-cadh-zsG-DD and treated with 1.0 µM Shield-1 using the same mAb as in A). Graph (right) represents analyses performed on three independent induction experiments. Cell lysates of 231LN cells expressing E-cadherin-zsG are shown in the first lane. Lysates of cells expressing E-cadherin-zsG-DD were collected at 0, 4, 8, 12, 16, and 24 hrs after Shield-1 treatment (1.0 µM final), revealing accumulation of Shield-1 stabilized E-cadherin-zsG-DD within cells (∼135 kDa). Far right lane is a positive control of 21PT cells [32] which endogenously express high levels of E-cadherin (∼110 kDa). C) Western immunoblot analysis of markers for epithelial-mesenchymal transition (EMT). Blot (left panels) reveals a decrease in vimentin protein levels when E-cadh-zsG-DD is induced by 1.0 µM Shield-1 treatment. Graph (right) represents analyses performed on three independent induction experiments.

