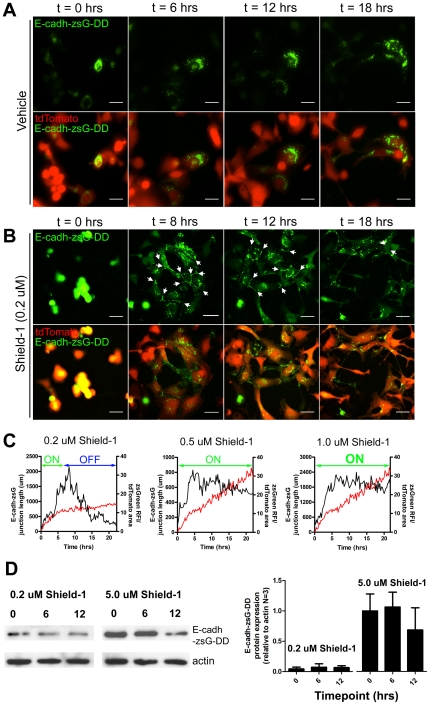
Figure 5. Time-lapse imaging of E-cadherin induction and kinetics of cell-cell junction formation in vitro.
Fluorescence in vitro time-lapse imaging of 231LN cells containing inducible E-cadherin treated with vehicle (A) or 0.2 µM Shield-1 which will produce an induction and depletion effect over 24 hours (B). Data Scale bar is 25 µm. C) Measure of “actively engaged" E-cadherin in 231LN cells in the presence of varying levels of Shield-1 (0.2, 0.5, and 1.0 µM Shield-1), expressed as the cumulative length of all zsG-positive adherens junctions over time (µm/hrs) in representative time-lapse experiments. The black kinetic represents the total cumulative length of E-cadherin-based junctions within a field of view at that timepoint while the red kinetic represents the accumulation of zsGreen-DD exposed to similar Shield-1 treatment. The “induction” and “depletion” phases of chemical induction are annotated in each graph. D) Conditioned media collected from cells expressing pzsGreen-DD which were treated with 0.2 µM Shield for 0, 6 and 12 hours were used to induce E-cadherin-zsGreen-DD expression in 231LN cells expressing E-cad-zsG-DD. There is induction with the 0 and 6 hours conditioned media, but minimal effect with the 12 hour conditioned media. Conversely, conditioned media from cells treated with 5.0 µM Shield-1 induced E-cadherin-zsG-DD expression regardless of the time of conditioned media collection. Graph (Figure 5D, right) represents data from three independent western immunoblot experiments.

