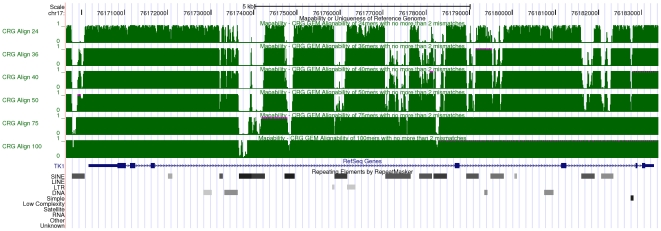
Figure 3. Visualization of mappability on the UCSC browser [7]: the example of the human TK1 gene.
Six mappability tracks (green) are shown here corresponding to  -mer sizes
  ,
,  ,
,  ,
,  and
and  bp (from top to bottom of the figure). Regions with low mappability score have high frequencies, and conversely. This example illustrates that the uniqueness of the TK1 locus (especially within the introns) could be inversely correlated with the presence of some repetitive elements as identified by RepeatMasker [37].

