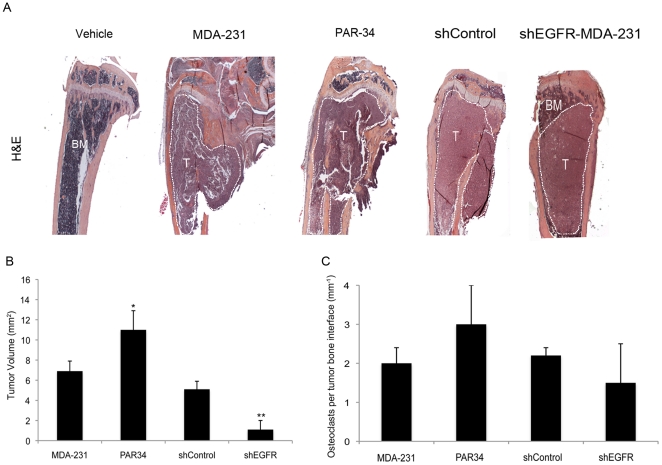
Figure 4. Histomorphometric analysis of tumor bearing bones.
(A) Representative images of H&E stained tibiae from each treatment group. Tumor region outlined in white, BM = bone marrow, T = Tumor. (B) Histomorphometric tumor volume analysis on H&E stained tibia sections. Care was taken to measure the same size tissue volume on each section. *p<0.05 and **p<0.01. (C) Osteoclast counts of TRAP stained slides from each treatment group. p = not significant, n = 10 mice per group.

