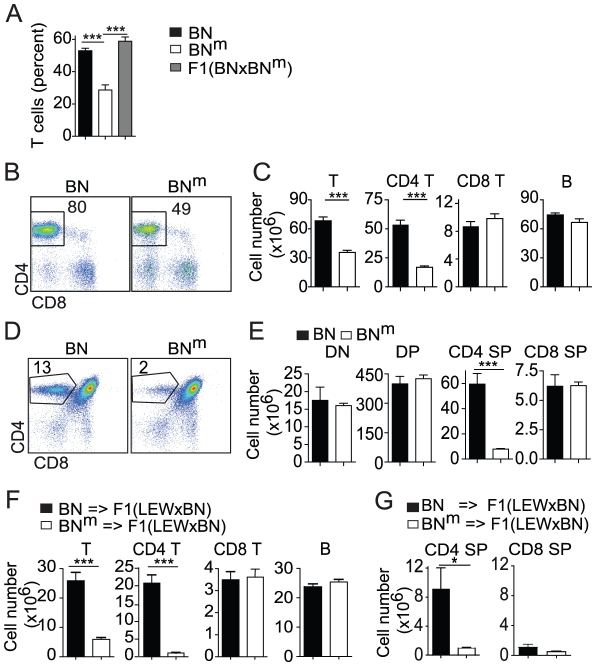
Figure 1. BNm rats exhibit a T cell autonomous lymphopenia restricted to CD4 T cells.
(A) Percentage of TCRαβ positive cells in PBMC from BN (n = 15, black bars), BNm (n = 9, white bars) and (BN×BNm) F1 (n = 5, grey bars) rats. (B) CD4 and CD8 expression in BN and BNm spleen T cells; numbers indicate the cell percentages in the outlined area. (C) Absolute numbers of BN (n = 4) and BNm (n = 9) T cells, CD4+ and CD8+ T cells, and B cells in spleen. Data in B and C are representative of five independent experiments. (D) CD4 and CD8 expression in BN and BNm thymocytes; numbers indicate cell percentages in the outlined area. (E) Absolute numbers of BN (n = 5) and BNm (n = 5) in thymocyte subsets (DN: double negative; DP: double positive; SP: simple positive). Data in D and E are representative of six independent experiments. (F) Absolute numbers of lymphocytes in spleen of lethally irradiated (LEW×BN) F1 rats reconstituted with BN (n = 6) or BNm (n = 8) T cell-depleted bone marrow cells. Data are representative of three independent experiments. (G) Absolute numbers of donor CD4 SP and CD8 SP cells in thymus of sub-lethally irradiated (LEW×BN) F1 rats 15 days after intrathymic injection of DN thymocytes from BN (n = 4) and BNm (n = 4) rats. (BN: black columns, BNm: white columns).

