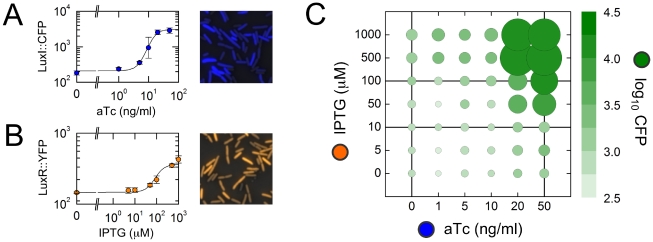
Figure 3. The promoter logic function of pR.
(A,B) Input LuxI::CFP and LuxR::YFP values as functions of the inducers aTc and IPTG, respectively; data are fit to Hill functions (Eq. S4) with parameters given in Table S4. To the right of each graph we show inverted phase-contrast images of E. coli cells overlaid with pseudocolor fluorescence data of LuxI::CFP and LuxR::YFP levels. Datapoints on the graph are population averaged values of fluorescence-per-pixel in the CFP and YFP channels; error bars represent standard deviations over replicates. (C) Bubble-plot of the measured promoter logic function of pR at the nominal cell density OD600 = 0.1. Here, aTc (hence LuxI::CFP) is varied along the x-axis; IPTG (hence LuxR::YFP) is varied along the y-axis; the area of the circle at each combination of input values represents the resulting CFP output level (which can also be read out using the colorbar). Vertical or horizontal cuts correspond to the input-output characteristics shown in Fig. 5A,D; these can be used to predict LuxR-feedback or LuxI-feedback responses, respectively.

