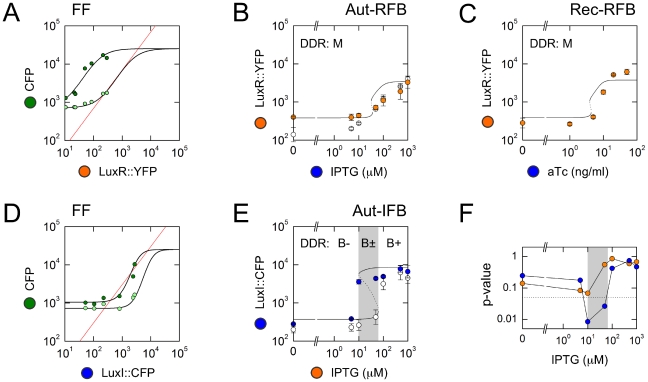
Figure 5. Model-based predictions.
(A,D) Intersections of input-output characteristics (IOCs: black curves, generated using Eq. 6, Table S3, and Eq. S4, Table S4) with lines of equivalence (red lines, generated using Eq. S3, Table S3). Datapoints show CFP values from the PLF; fluorescence values are background-subtracted. Since the promoters driving the regulators have lower maximal transcription rates than pR, datapoints lie in a low band of regulator values. Fitted IOCs appear to have the same maximal value because the half-saturation concentration for LuxR-DNA binding is ∼1 LuxR molecule per cell, far below available total LuxR (Supporting Information, Text S1: AHL and LuxR biochemistry). (B,C,E) Predicted (curves) and measured (datapoints) terminal responses for the three feedback loops. Each datapoint gives the mean fluorescence of a cell population; error bars represent standard deviations over replicates. (A) For predicting LuxR-feedback response, the IOC is a vertical slice of the PLF (keeping aTc and LuxI fixed, while varying IPTG and LuxR); for example, we show IOCs corresponding to aTc = 0 ng/ml and 50 ng/ml (Fig. 3C). (B) Feedback response of Aut-RFB. White datapoints show the terminal response of OFF-history cells; orange datapoints show the terminal response of ON-history cells. There is no evidence of hysteresis; we infer that all DDRs are monostable, type M. (C) Feedback response of Rec-RFB. Orange datapoints show measured terminal responses. We infer that all DDRs are monostable, type M. (D) For predicting LuxI-feedback response, the IOC is a horizontal slice of the PLF (keeping IPTG and LuxR fixed, while varying aTc and LuxI); for example, we show IOCs corresponding to IPTG = 10 µM and 100 µM (Fig. 3C). (E) Feedback response of Aut-IFB. White datapoints show the terminal response of OFF-history cells; blue datapoints show the terminal response of ON-history cells; the grey box highlights the hysteretic region. We infer that DDRs in the hysteretic IPTG range are bistable, type B±, while those below and above this range are type B− and B+ respectively. (F) Quantifying hysteresis for autonomous feedback loops Aut-RFB (orange) and Aut-IFB (blue). We show p-values from a T-test quantifying the differences between the terminal responses of ON-history and OFF-history cells over replicates; the dotted line shows p = 0.05. Only the Aut-IFB system shows significant hysteresis (grey box).

