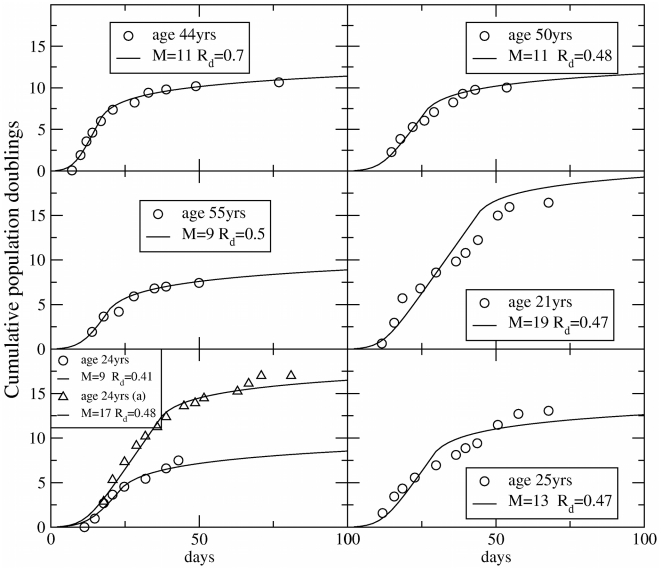
Figure 3. Growth curves of mesenchymal stem cells (BM).
The growth of populations of MSC isolated from the bone marrow from the iliac crest in terms of cumulative population doublings are fitted by the model. Experimental data are obtained from Ref. [28]. The best fit is obtained varying  and
and  in Eq.7.

