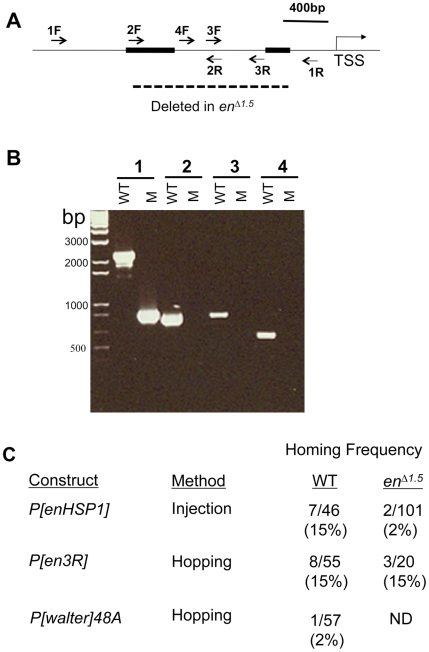
Figure 4. Characterization of and homing to the enΔ1.5 chromosome.
(A) Thin line represents DNA upstream and including the transcription start site (TSS) of en. PRE1 and PRE2 are depicted by rectangular boxes. The primers used for PCR reactions are indicated. The extent of the enΔ1.5 deletion is indicated by the dashed line. (B) PCR reactions using wild type (WT) or enΔ1.5 DNA (M) and the following primer sets (1) 1F and 1R (2) 2F and 2R (3) 3F and 1R (4) 4F and 3R. The M PCR product from primer set 1 was sequenced and shows that 1462 bases are deleted in enΔ1.5. (C) Homing frequency onto wild type and enΔ1.5 chromosomes. Homing frequency is the number of insertions near the en/inv region/the total number of transgenic lines. ND, not done.

