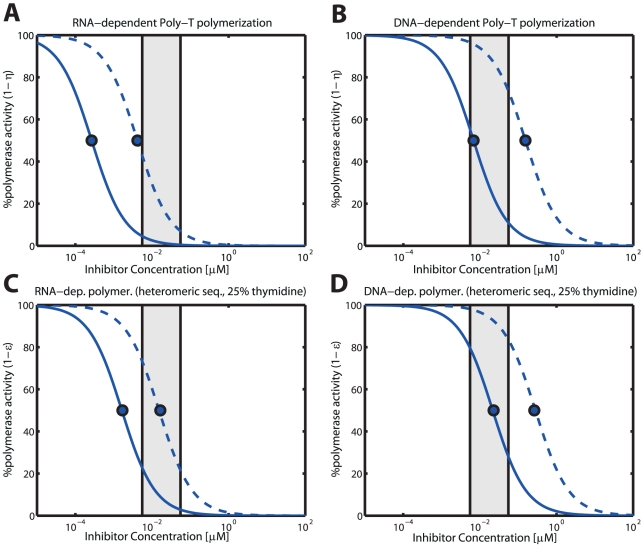
Figure 4. RNA- and DNA-dependent polymerization in the presence of intracellular AZT triphosphate in unstimulated  T-cells.
The solid blue curves indicate the level of residual polymerization with the wild type enzyme, whereas the dashed lines indicate the residual polymerization with the ‘D67N/K70R/T215Y/K219Q’ mutant. Panels A & B: Residual RNA- and DNA dependent polymerization of a homo-polymeric thymidine sequence (Poly-‘T’). Calculations were obtained by solving eq. (19). Panels C & D: RNA- and DNA polymerization of a hetero-polymeric random sequence of length 500 with 25% respective dNTP content. The illustration was generated using eq. (10). The light grey area indicates the in vivo concentrations range of AZT in purified circulating  T-cells from [71], converted to units
  by assuming a cell volume of
  for resting
  T-cells [72]. All utilized parameters are indicated in Tables 1, S1, S2, S3 (supplementary material).

