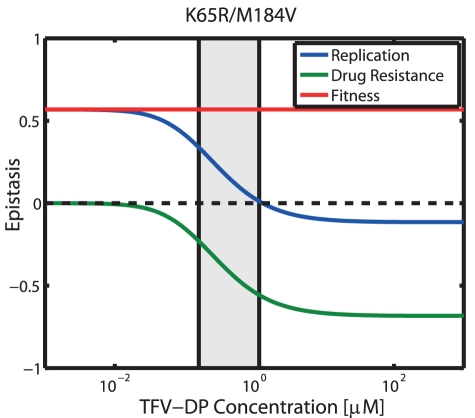
Figure 8. Epistatic interactions for DNA-dependent polymerization in the presence of TFV-DP.
Solid blue-, green- and red line indicate epistasis with regard to replication  , resistance
  and fitness
  as defined in eqs. (5)–(7) for the double mutant ‘K65R/M184V’. The black dashed horizontal line indicates the value, where no epistatic interactions occur. The light grey area indicates the in vivo concentrations range of TFV-DP from [56], [71], [73], converted to units
  by assuming a cell volume of
  for unstimulated
  T-cells [72]. All utilized parameters are indicated in Table 1 and Tables S1, S2 (supplementary material).

