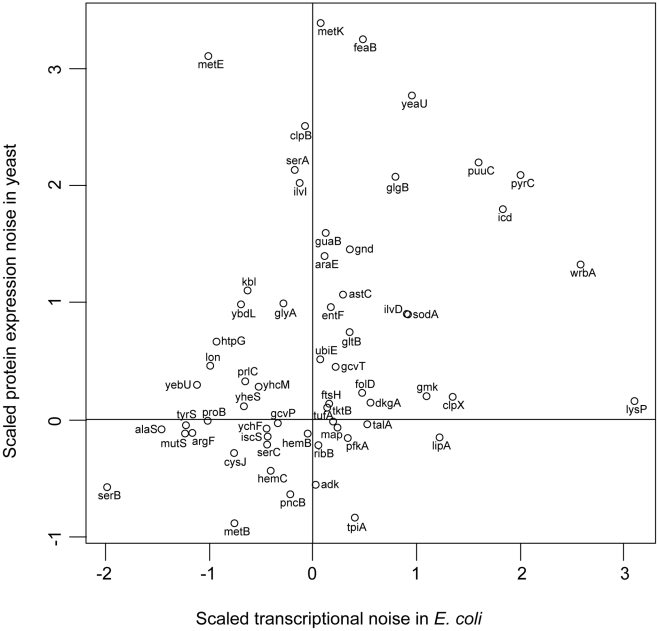
Figure 4. E. coli and yeast orthologues have similar noise levels.
Orthologues in S. cerevisiae were determined through a reciprocal best-hit analysis for all the genes in E. coli. The number of reciprocal best-hit orthologues depended on the e-value cut-off that was set; this plot shows all orthologues with an e-value lower than e-35 (rho = 0.31, p = 0.015, n = 60). The data on yeast noise are from [24]; noise values for both S. cerevisiae and E. coli have been scaled such that the mean is zero and the standard deviation in noise is one.

