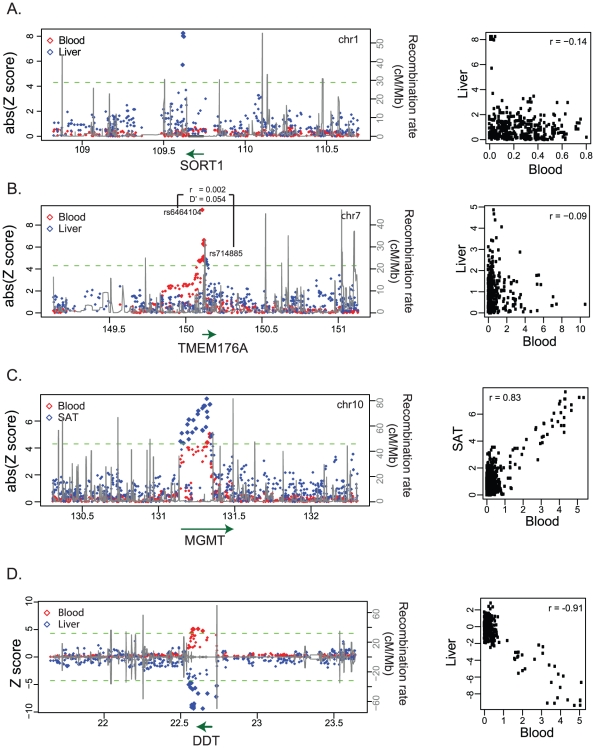
Figure 3. Case examples for tissue-dependent cis-regulation.
(A) The liver-specific regulation of the SORT1 gene. (B) The alternative regulation of the TMEM176A gene in blood and liver. (C) The cis-regulation for the MGMT gene had different effect sizes in blood and SAT. (D) The cis-regulation for the DDT gene show opposite allelic direction between blood and liver. For each gene, the left panel shows the cis-eQTL association profile in the corresponding tissue (liver or SAT, in blue) vs the association profile in blood (red). The x-axis is the genome position based on genome build 36.3 (in Mb). The y-axis at the left is the association strength in terms of Z-score. The Z-score in blood has been weighted by the square root of the sample size, corresponding to the compared tissue. The dashed green line indicates the significance level of association at FDR 0.05. We use the absolute Z-scores to show the association in (A–C), but use the Z-scores in (D) for a better illustration of allelic direction. We assigned the association Z-scores in blood a negative value. If the allelic direction in SAT is the same as that in blood, the Z-score in SAT is negative too; otherwise, the Z-score in SAT is positive. The black line shows the recombination rate at this locus based on the HapMap II CEU panel and the scale is indicated on the right-hand y-axis. The green line with arrow at the bottom shows the genome position of the gene and the arrow indicates the transcription direction. The right panel shows the correlation of the Z-scores between two tissues. The r-value indicates the correlation coefficient of the Pearson correlation.

