Figure 1.
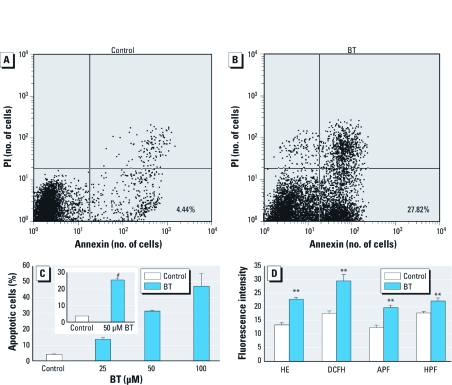
Apoptosis and intracellular ROS. (A,B) Representative dot graphs of unexposed HL-60 cells (control; A) and cells exposed to 50 μM BT for 8 hr (B). Cells in the lower right quadrant, which were stained with annexin V but not PI, were considered to be apoptotic; percentages of these cells in are shown in the figure. (C) Percentages of apoptotic HL-60 cells after exposure to BT for 8 hr; data presented are mean + SE from two independent experiments conducted in duplicate. Inset, percentages of apoptotic cells in controls or HL-60 cells exposed to 50 μM BT for 8 hr (mean + SE of 15 independent experiments conducted in duplicate). (D) Fluorescence intensities, corresponding to levels of various ROS, in controls or cells exposed to 50 μM BT for 30 min (mean + SE from 5–7 independent experiments conducted in duplicate). Fluorescence intensity is shown in arbitrary units. **p < 0.01, and #p < 0.001, compared with control.

