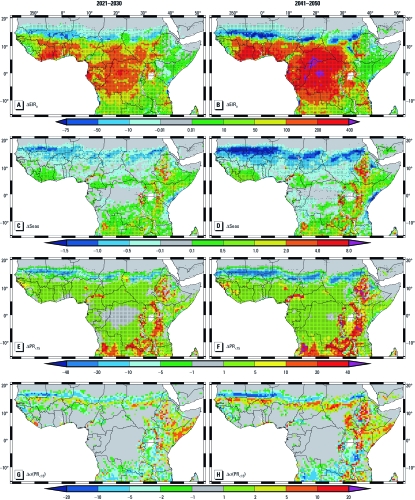
Figure 3.
LMM2010 and S2005 model-projected malaria changes relative to the present-day modeled distribution (1960–2000). (A–D) illustrate the LMM2010-simulated changes in EIRa (A and B) and Seas (C and D). (E–H) S2005 model-projected changes in PR<15 (E and F) and σ(PR<15) (G,H). The values are for 2021–2030 (A,C,E,G) and 2041–2050 (B,D,F,H) compared with the A1B scenario. For A–F, the values that are statistically significant at the 5% level according to the Wilcoxon–Mann–Whitney rank-sum test (Helsel and Hirsch 2002) are marked by the black dots. The value scales for A and B are infectious bites per human per year, C and D are months, and E–H are percentages.

