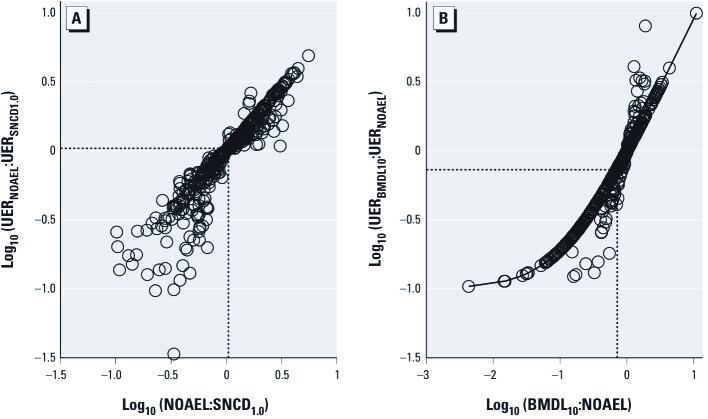
Figure 5.
Correlations between differences in dose and UER. (A) Correlation between NOAEL:SNDC1.0 and UERNOAEL:UERSNDC1.0 based on the 439 data sets (circles) for which an SNCD1.0 was derived. The median dose and risk ratio, shown by the vertical and horizontal lines, are both 1. (B) Correlation between BMDL10:NOAEL and UERBMDL10:UERNOAEL, based on the 439 data sets (circles) for which an SNCD1.0 was derived. Observe that the UER at BMDL10 is 0.10. The median dose and risk ratio are 0.71 and 0.73, respectively (if all 786 data sets adequate for modeling are considered, the median dose and risk ratio are both 0.93). Circles in B situated along the curved line correspond to data sets for which the Hill coefficient η = 1; the other circles correspond to data sets for which η > 1.

