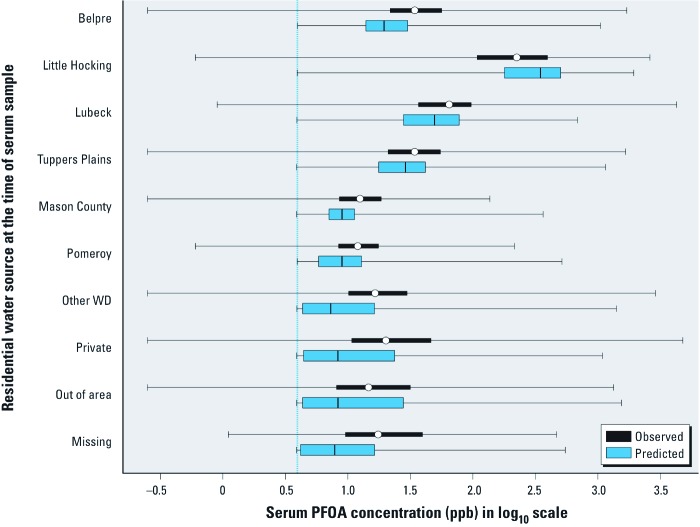
Figure 2.
Box-and-whisker plots of predicted and observed serum PFOA concentrations (parts per billion) in 2005–2006 by water district (WD). The vertical line indicates the median background serum concentration in 2005–2006 in human serum samples. Lines and circles within boxes indicate median concentrations, boxes correspond to the 25th and 75th percentiles, and whiskers indicate minimum and maximum values.

